

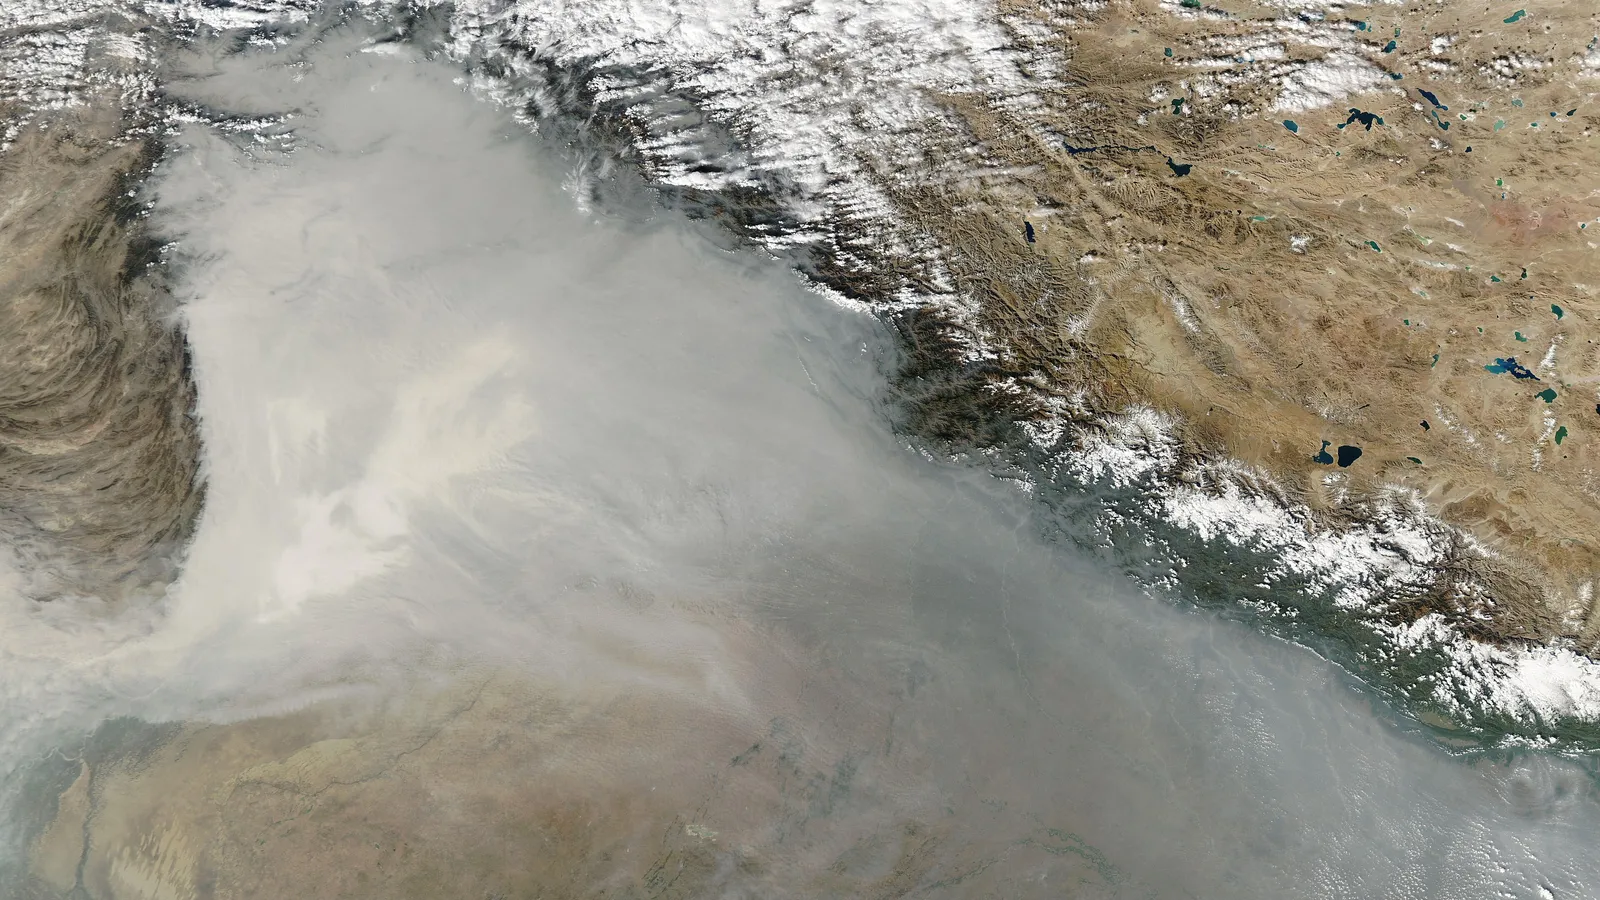
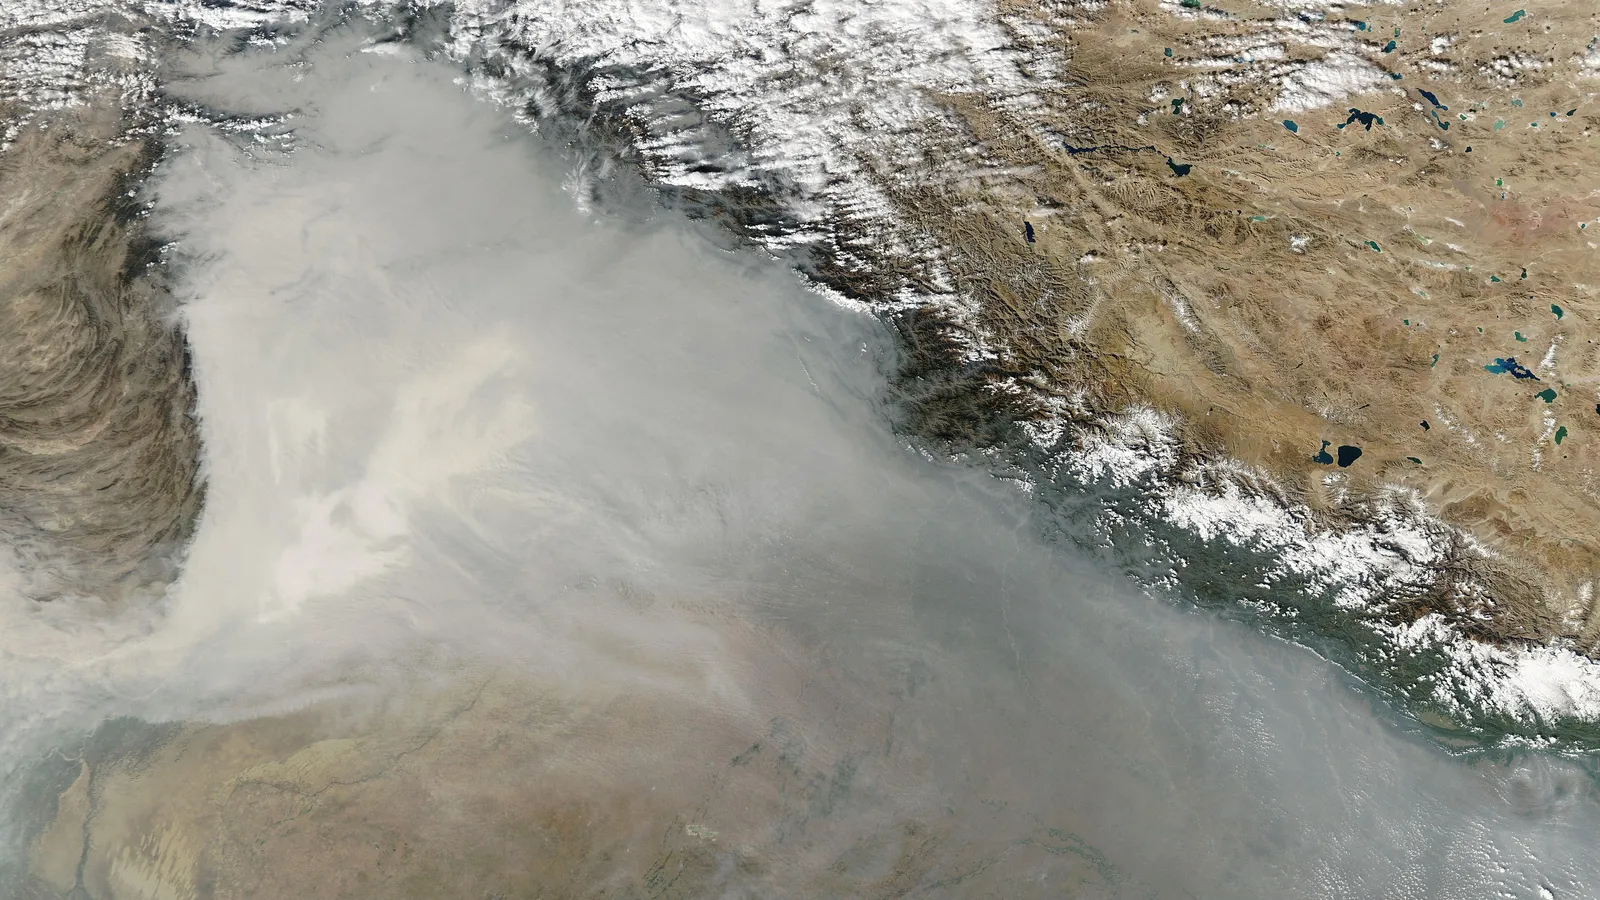
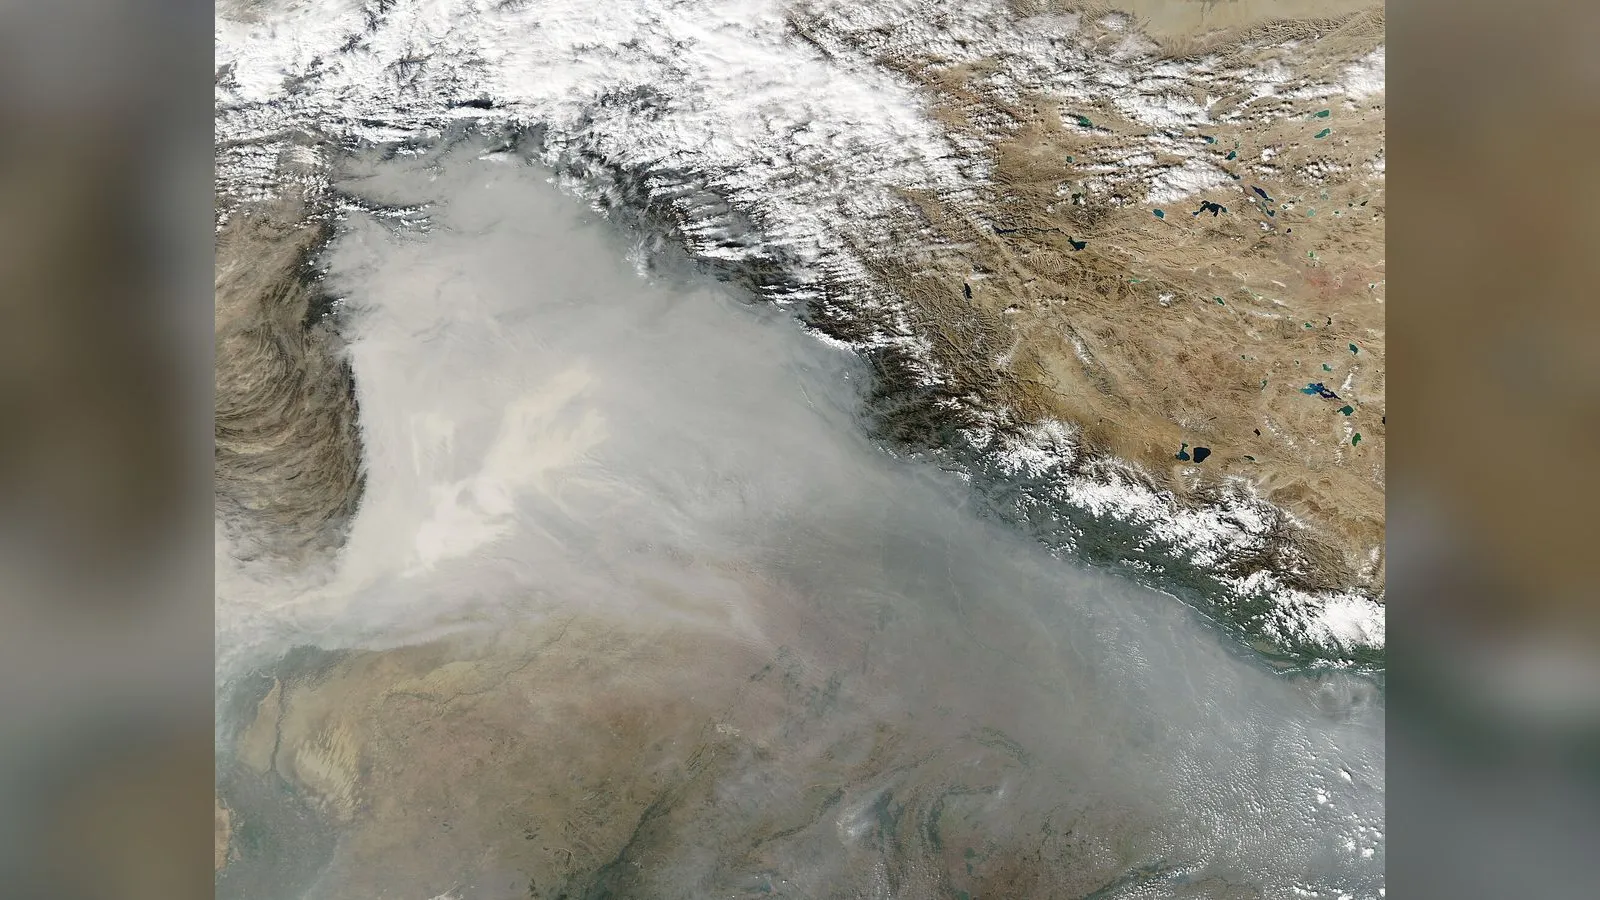
Lahore returned to the top of the world’s most polluted major cities on Wednesday, with an air quality index (AQI) of 339, and several other Punjab cities recorded worse readings, according to IQAir. Readings above 300 are classed as hazardous, meaning serious health risk, particularly for children, older people and people with respiratory and heart conditions, Dawn reported.
The rankings
IQAir’s live ranking of major cities for 10am to 11am on November 18 put Lahore first. Karachi was sixth.
| Rank | City | AQI |
|---|---|---|
| 1 | Lahore | 339 |
| 2 | Dhaka | 221 |
| 3 | Baghdad | 199 |
| 4 | Tashkent | 182 |
| 5 | Kolkata | 178 |
| 6 | Karachi | 174 |
IQAir’s separate real-time ranking of Pakistani cities shows that Lahore was not the worst in the country at that hour. Faisalabad was at 686 and Gujranwala at 550, while Lahore, at 339, ranked sixth:
| City | AQI |
|---|---|
| Faisalabad | 686 |
| Gujranwala | 550 |
| Kahna Nau | 516 |
| Multan | 437 |
| Kasur | 371 |
| Lahore | 339 |
| Khanewal | 327 |
| Sargodha | 314 |
| Sahiwal | 253 |
| Dera Ghazi Khan | 238 |
This is why a “world’s most polluted major city” headline can understate how bad the air is elsewhere in the province. The ranking of major cities compares only the largest cities, and many of Punjab’s worst readings come from smaller ones.
What the EPA is doing
Punjab’s Environment Protection Agency (EPA) has posted senior officers from its headquarters in divisions to supervise anti-stubble-burning operations directly, rather than relying on routine reports from the field. Director General Abdullah Nayyer Sheikh said the officers will verify reported fires, find gaps in operations and make sure detected hotspots get a timely response.
An order issued on November 13 assigned five directors to Gujrat, Sahiwal, Faisalabad, Lahore and Gujranwala divisions for November 14 and 15. They are to report violations with evidence through the agency’s WhatsApp groups and file field reports with the director general.
The fire data
The EPA’s district monitoring dashboard, updated on November 14, shows where the crop fires are:
| District | Fire anomalies detected | Pending | Response rate |
|---|---|---|---|
| Hafizabad | 430 | 49 | n/a |
| Sheikhupura | 172 | 18 | 89.5% |
| Nankana Sahib | 120 | 25 | 79.2% |
| Faisalabad | 93 | 3 | 96.8% |
| Kasur | 70 | n/a | n/a |
| Sialkot | 10 | n/a | n/a |
| Sargodha | 2 | n/a | n/a |
| Gujranwala | 1 | 1 (unattended) | n/a |
| All eight districts | 898 | 96 | 91.3% |
According to the agency, 820 incidents had been attended and 823 fires extinguished across the eight districts, and 67 quick-response crews were deployed. Hafizabad alone accounts for nearly 48 per cent of the provincial total, and Hafizabad, Sheikhupura and Nankana Sahib together account for 722 of the 898. Hafizabad had nine crews, compared with 22 in Sheikhupura. Separately, motorway patrol vehicles recorded 20 fire anomalies in 24 hours, of which 13 were attended, a 65 per cent response rate. Six vehicles covered 1,770 kilometres against an assigned route length of 598 kilometres. These are the EPA’s figures and we have not been able to verify them.
Background
The ranking has changed hands all month. We reported on Lahore’s AQI passing 530 and Gujranwala hitting 606 at the start of November, and on Lahore topping the list at 590 after Diwali smoke and stubble fires. Wednesday’s 339 is lower than those, but it is still in the hazardous range.
Why it matters
Two points stand out in the data. The fire detections are concentrated: three districts account for four out of five of them, which suggests enforcement could be targeted there. And the response rate falls where the numbers are largest: Hafizabad had the most fires and only nine crews, while Faisalabad, with far fewer fires, had a 96.8 per cent response.
The EPA figures also show the limits of reporting after the fact. The dashboard is from November 14, four days before the readings of Wednesday. Residents deciding whether to send a child to school or go for a walk need the number from today, and IQAir’s hourly figures are the closest available guide.
What to watch: an updated EPA dashboard, whether Hafizabad’s crew numbers rise, and whether this week’s readings fall when the wind changes.
Comments
Comments are reviewed by our editors before they appear. Please keep them civil and on topic. See our terms.
No comments yet. Be the first to share your view.